

Extension
-
Hurricane Impacts
Hurricane Impacts
September 20, 2018

Hurricanes are the most powerful and largest weather event happening in the air, affecting almost everything in their paths. Their strong winds and heavy rain can directly impact both inland and coastal areas in short periods, usually around a day. Understanding hurricane effects is the first step to preparing for hurricanes. The effects of hurricanes can be comprehensive and long-lasting, even permanent, at the spatial scales of a single molecule to whole ecosystems. Much effort has been made to come up with ways to accurately predict, effectively prepare for, and quickly recover from hurricanes, but their sizes and complexity make this difficult. Multidisciplinary collaborations are required to improve our understanding of hurricanes. Here, we review basic facts of hurricanes and their effects in Florida and speculate on how they might affect Florida’s agriculture and natural resources. Examples and speculations provided in this article demonstrate how weather, agriculture, environment, and ecosystem are connected to each other across spatial scales ranging from microorganisms to an entire landscape.
-
Scientific Irrigation Scheduling using Dual Crop Coefficients
Scientific Irrigation Scheduling using Dual Crop Coefficients
August 26, 2017

Estimating the amount of water evaporated from soil and transpired from vegetation is a necessary process in many engineering and science fields, such as water resources planning, hydrologic analysis, and agricultural water management, as evapotranspiration (ET) controls the moisture content of soil, one of the most important freshwater storages in the earth. A reference evapotranspiration (ET0) rate represents the amount of water that the air can take and hold in a time interval, and it is determined only by weather variables including solar radiation and wind speed. On the other hand, an actual amount of water evaporated and/or transpired can be limited by the soil moisture content and transpiration capacity of the crop plants (Allen 2000). A crop coefficient (Kc) method has served as a convenient way to estimate an actual ET for crop plants (ETc) rate based on a reference evapotranspiration rate estimate and the types of plants located in an area of interest (Irmak and Haman 2003; Zotarelli et al. 2010). The method has been a useful and popular way particularly for ET-based irrigation scheduling due to the simplicity (Kisekka et al. 2009a; 2009b). The crop coefficient method has two different approaches, single and dual crop coefficient(s). The single coefficient method represents averaged effects of evapotranspiration from a cropped surface, while two independent coefficients are required for the dual crop coefficient method taking into account evaporation from soil and transpiration from vegetation separately (Allen et al. 1998). The single crop coefficient approach is relatively simple, however, the dual crop coefficient approach can more effectively consider a soil moisture condition and plant drought stress that can limit evaporation and transpiration, respectively, in an actual evapotranspiration rate estimation. In this document, we introduce the concept of the dual crop coefficient method that allows considering evaporation and transpiration separately in irrigation scheduling and then demonstrates a way of scheduling irrigation by calculating time-varying evapotranspiration rates of a crop field using the method. Material presented in this document is intended to improve the knowledge base of water management and irrigation professionals and can be applied to agricultural production.
-
How Likely is a 100-year Rainfall Event During the Next 10 Years?
How Likely is a 100-year Rainfall Event During the Next 10 Years?
August 26, 2017
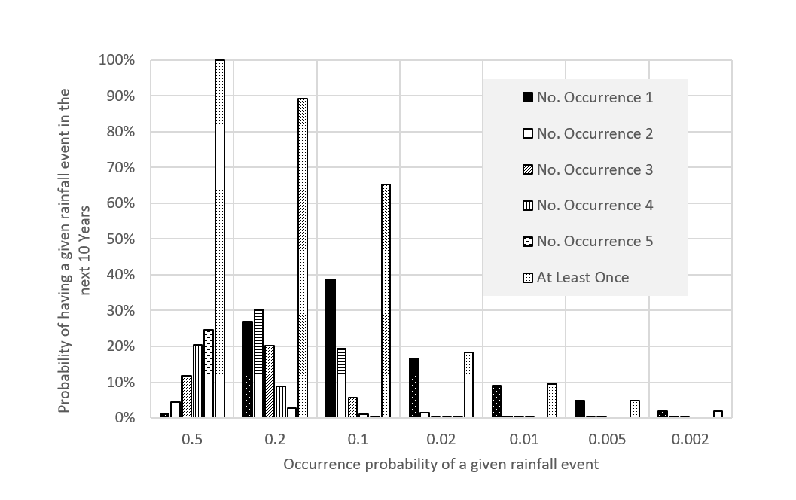
Hydrologists and water resources engineers examine historical rainfall observations to figure out how large potential storm events may be and how often a large event of interest comes in a probabilistic sense. Such investigation and estimation processes are called rainfall frequency analysis. Information regarding the size and frequency of extreme hydrologic phenomena such as storm events, floods, and droughts is used to determine the capacity of a hydraulic structure and assess its failure risk. Rainfall frequency analysis finds a probability distribution that provides a good fit to rainfall depth observations and then uses the distribution to calculate the size of events that can occur with various probabilities, such as 0.5%, 1%, 10%, and 50%, in a year. The probability of the occurrence of a given rainfall event is sometimes expressed with a recurrence interval (or return period), which represents the “average period between years in which a given rainfall depth is exceeded at least once” (NOAA, 2017). However, the concept of the recurrence interval and the term “average” often create confusion regarding the expected frequency of a given event (Chow 1953; Perica et al. 2013). This article explains how to appropriately interpret a rainfall (or flood) event with a certain probability and recurrence interval to promote understanding of the concept of a design storm and the capacity of hydraulic structures. This document focuses on rainfall, but the same explanations and concepts are applicable to the cases of other extreme hydrologic phenomena such as floods and drought.
-
Florida Rainfall Data Sources and Types
Florida Rainfall Data Sources and Types
August 26, 2017

Florida climate is characterized by wet and dry seasons, with rainfall predominantly occurring between June and October. Annual rainfall amounts range from 40 to 60 inches per year depending on the location (Florida Climate Center 2016). Florida rainfall is also spatially variable, meaning rainfall may occur on one side of the street but not on the other side. This is particularly true during the rainy season when weather patterns are driven by thunderstorms Rainfall may be estimated between rain gauge locations using a combination of rain gauges, interpolation techniques, radar technology, and satellite imagery. Interpolation techniques are statistical procedures that estimate rainfall between gauge points. Radar and satellite data use different approaches to convert information collected by radar or satellite images into rainfall estimates over a spatial surface (Yilmaz et al. 2005).